


Where do we currently stand this year?
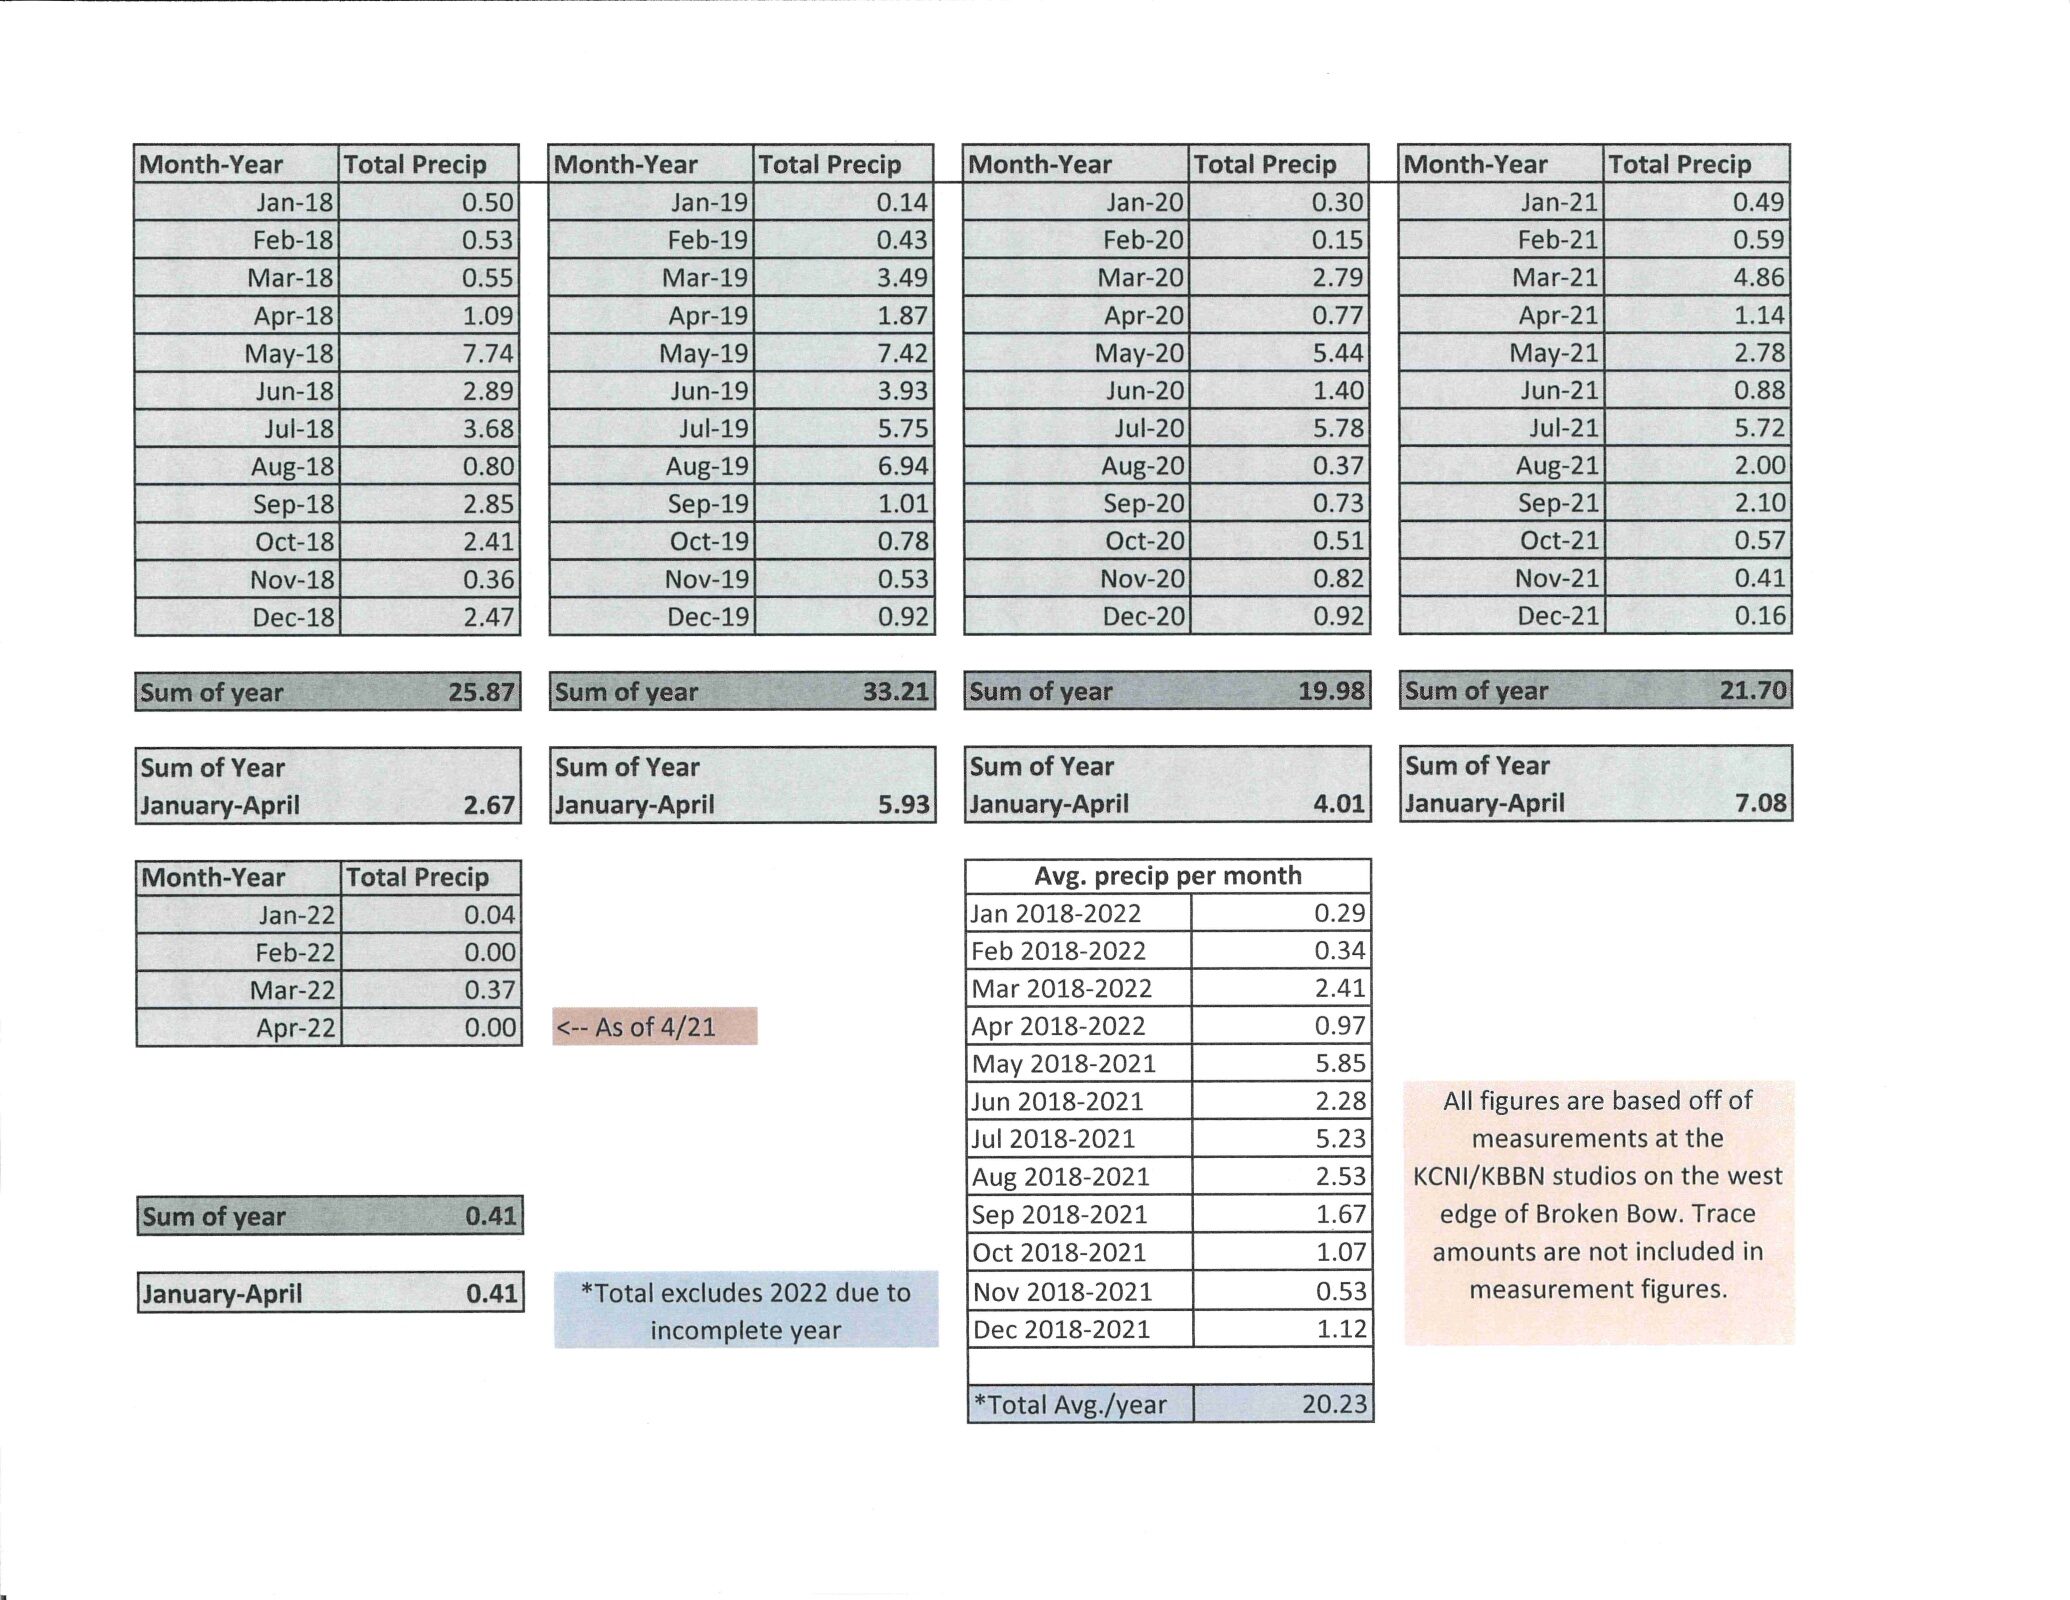
There is no denying we are incredibly dry, but how dry? At the KCNI/KBBN studios on the west edge of Broken Bow, the rain gauge is checked in the morning, at noon, and in the evening to gather the best data regarding moisture and to prevent as much evaporation as possible. As a disclaimer, during calm snow events, the moisture gathered in the gauge is melted down and measured. When high winds accompany the snow it creates an ‘inaccurate catch,’ which means there may be more or less moisture than measured or a margin of error.
Since 2018, the months with the most precipitation measured, on average, are May (5.85”) and July (5.23”). Excluding 2022, due to an incomplete year, the area receives on average 25.19” in a year.
Since the start of 2022 we have received .41” of measurable precipitation. Comparing to the years 2018-2021, with the same time frame (January-April), the area is approximately 4.51” behind the average amount of moisture received at this time.
If we compare the last eight months from September 2021 through April 2022, the area has received 3.65” of precipitation which is approximately 6.79” behind the average received at this same time since 2018.

Over the last several years, the region has seen multiple large weather events including snowstorms and flooding, however, these events were mostly isolated to just a few days. For example, the flooding in 2019 appeared to be an incredible amount of rain and, in some cases, it was. A factor in the large amount of standing water was that the ground was still frozen at the time, which did not allow the rain to soak into the soil. Of the 3.49” of measured precipitation for March, just over an inch was measured on March 14 which was the start of the flooding events throughout the state.
Excluding a very wet and snowy 2018, on average October through February has been moderately dry with no month having precipitation measuring over an inch. The recent dry winters usually lead us into a moderately wet March and April, but unfortunately, this year has not been that way. In addition, since 2018 the area has never experienced a month with zero measurable precipitation (excluding trace amounts). If we do not receive moisture in the next week, we will have had two months (February and April) that recorded no measurable precipitation.
Drought conditions continue to persist across the state with more counties falling into the extreme drought category according to the Drought Monitor Map. Nearly all of Nebraska is considered abnormally dry and over 73% of the state is considered in a severe drought.
While not perfect, the measurements listed give a general idea of where the region sits in regards to moisture. All measurements were taken at the KCNI/KBBN studios where there is very little outside interference as the area is void of trees, homes, vehicles, etc. Trace amounts (less than .01″) are not included in measurement figures.